Open the Retention report
Click Reports, then Retention. Reports must be enabled and your role must have permission to view them.
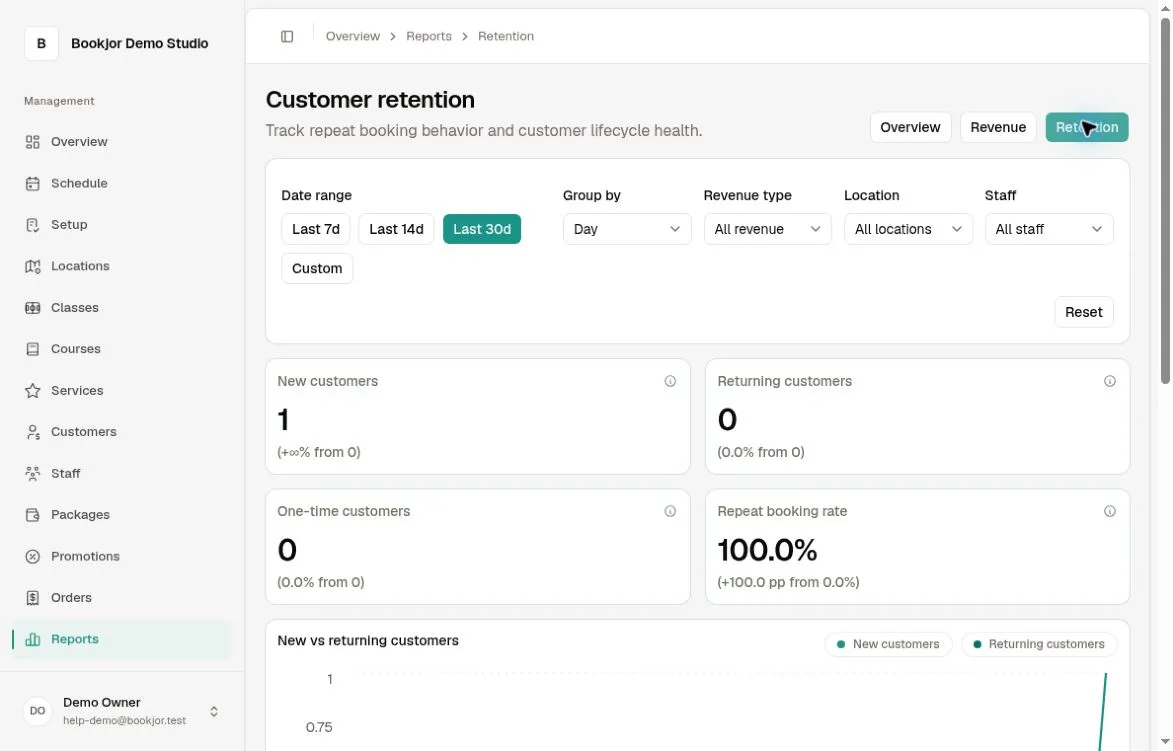
Use the shared 7-, 14-, or 30-day presets, or apply a custom range of at most 90 days, plus grouping, Revenue type, Location, and Staff filters. The report uses confirmed customer booking records and their creation dates in the studio’s timezone; family-member profiles are excluded.
Understand the lifecycle metrics
New customers first made a matching confirmed booking in the selected period. Returning customers booked in the period and also have an earlier matching confirmed booking.
One-time customers are new customers who have only one matching confirmed booking overall. Repeat booking rate is the share of new customers who made at least one further matching confirmed booking, including bookings created after the selected end date.
These definitions follow the selected revenue type, location, and staff filters. Later bookings can change a historical repeat rate. The cards compare with the preceding equal-length period; the information icons show definitions.
Compare trends and lifecycle mix
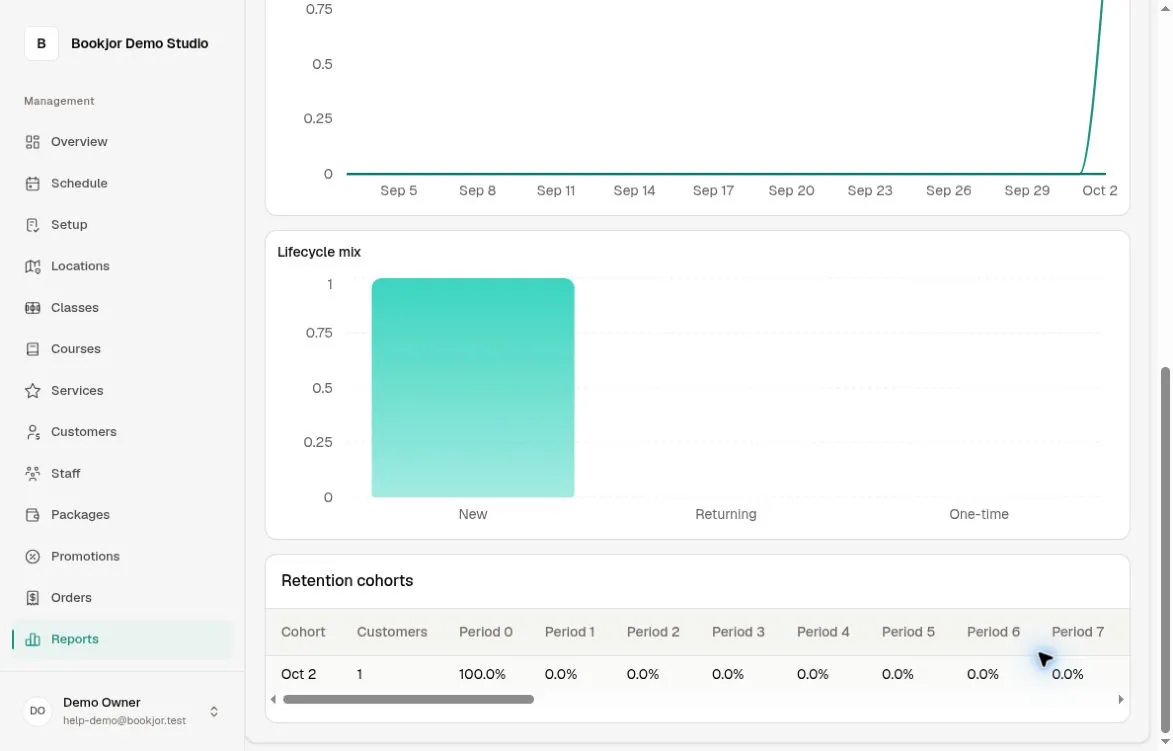
The New vs returning customers chart counts a customer once per day, week, or month: new in their first booking period, and returning in later periods. A customer can appear in more than one period, so do not sum the trend to recreate the period’s customer total.
One-time customers are a subset of New customers. The Lifecycle mix categories overlap and should not be added together as a unique-customer total.
Read the cohort table carefully
The Retention cohorts table contains customers whose first matching booking is within the selected range, grouped by that first booking’s day, week, or month. Period 0 is the starting group; later columns show the share with another booking in each later period within the range.
For a recent cohort, later columns may show 0% because those periods fall beyond the selected date range. This does not mean the customers have stopped returning. Compare groups that have had a similar amount of time to return.